The year 2011 from Meteosat
The last year, I've archived MSG-2 pictures every day at 11:45 UTC and then I made the following animations. The one for whole Earth, next one only for Europe and Atlantic hurricane area.
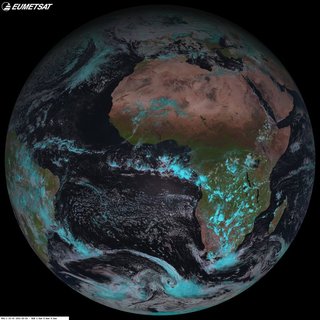
The Earth of 2011
The images were resizes from 3712×3712 to 720×720, and the speed of animation is 12 frames per sec. I set the bit-rate to 6400 kbsp to achieve maximal quality of animation, for lower bit-rates there was to much MPEG flickering.
The animation is long 29 seconds. Watch it more times and you'll see some interesting phenomenons. There are clearly visible vegetation changes around equatorial Africa between Solstices. During summer months there is Atlantic hurricane season, you can see their beginnings from local tropical storms around Africa coast and then they are travelling to the west Atlantic and sometimes getting stronger and stronger and change to hurricane.
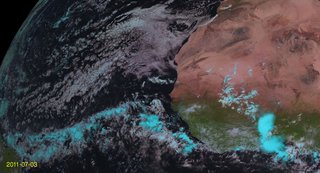
The detail of hurricane area
This is detail of the Atlantic hurricane area in original resolution.
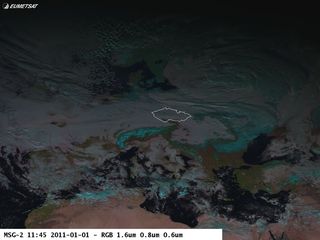
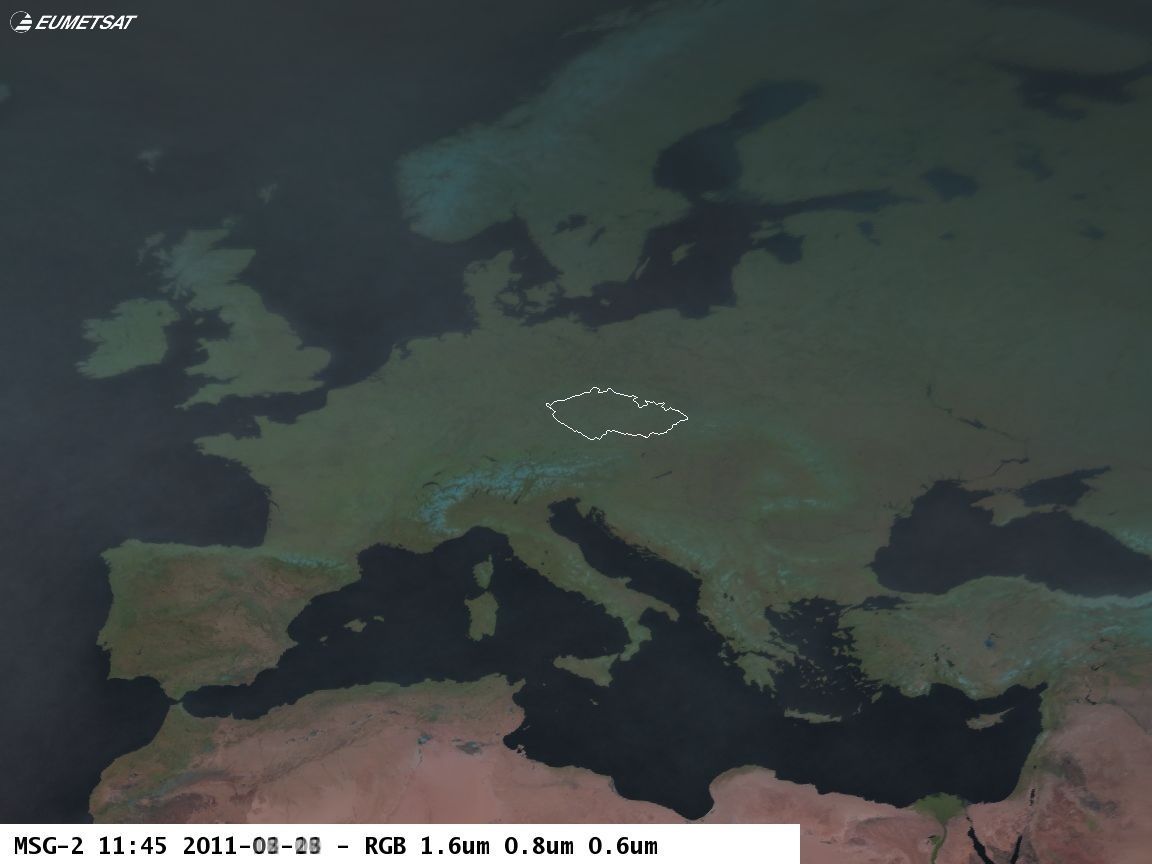
The Europe of 2011
This detail was taken from 3712×3712 imagery and the pictures are in the original resolution and transformed into equirectangular map projection. You can notice changes of Earth's axis slant, in winter months the northern part is much darker than in the summer. Also in Europe are vegetations changes visible, notice the nice change to green on the boundary of the months of April and May. At the beginning of 2011 the north-east part of Europe was covered by snow, in this spectral combination the snow is not clearly white, but has some kind of turquoise color. During months November and December there are many dense fogs around the Europe.
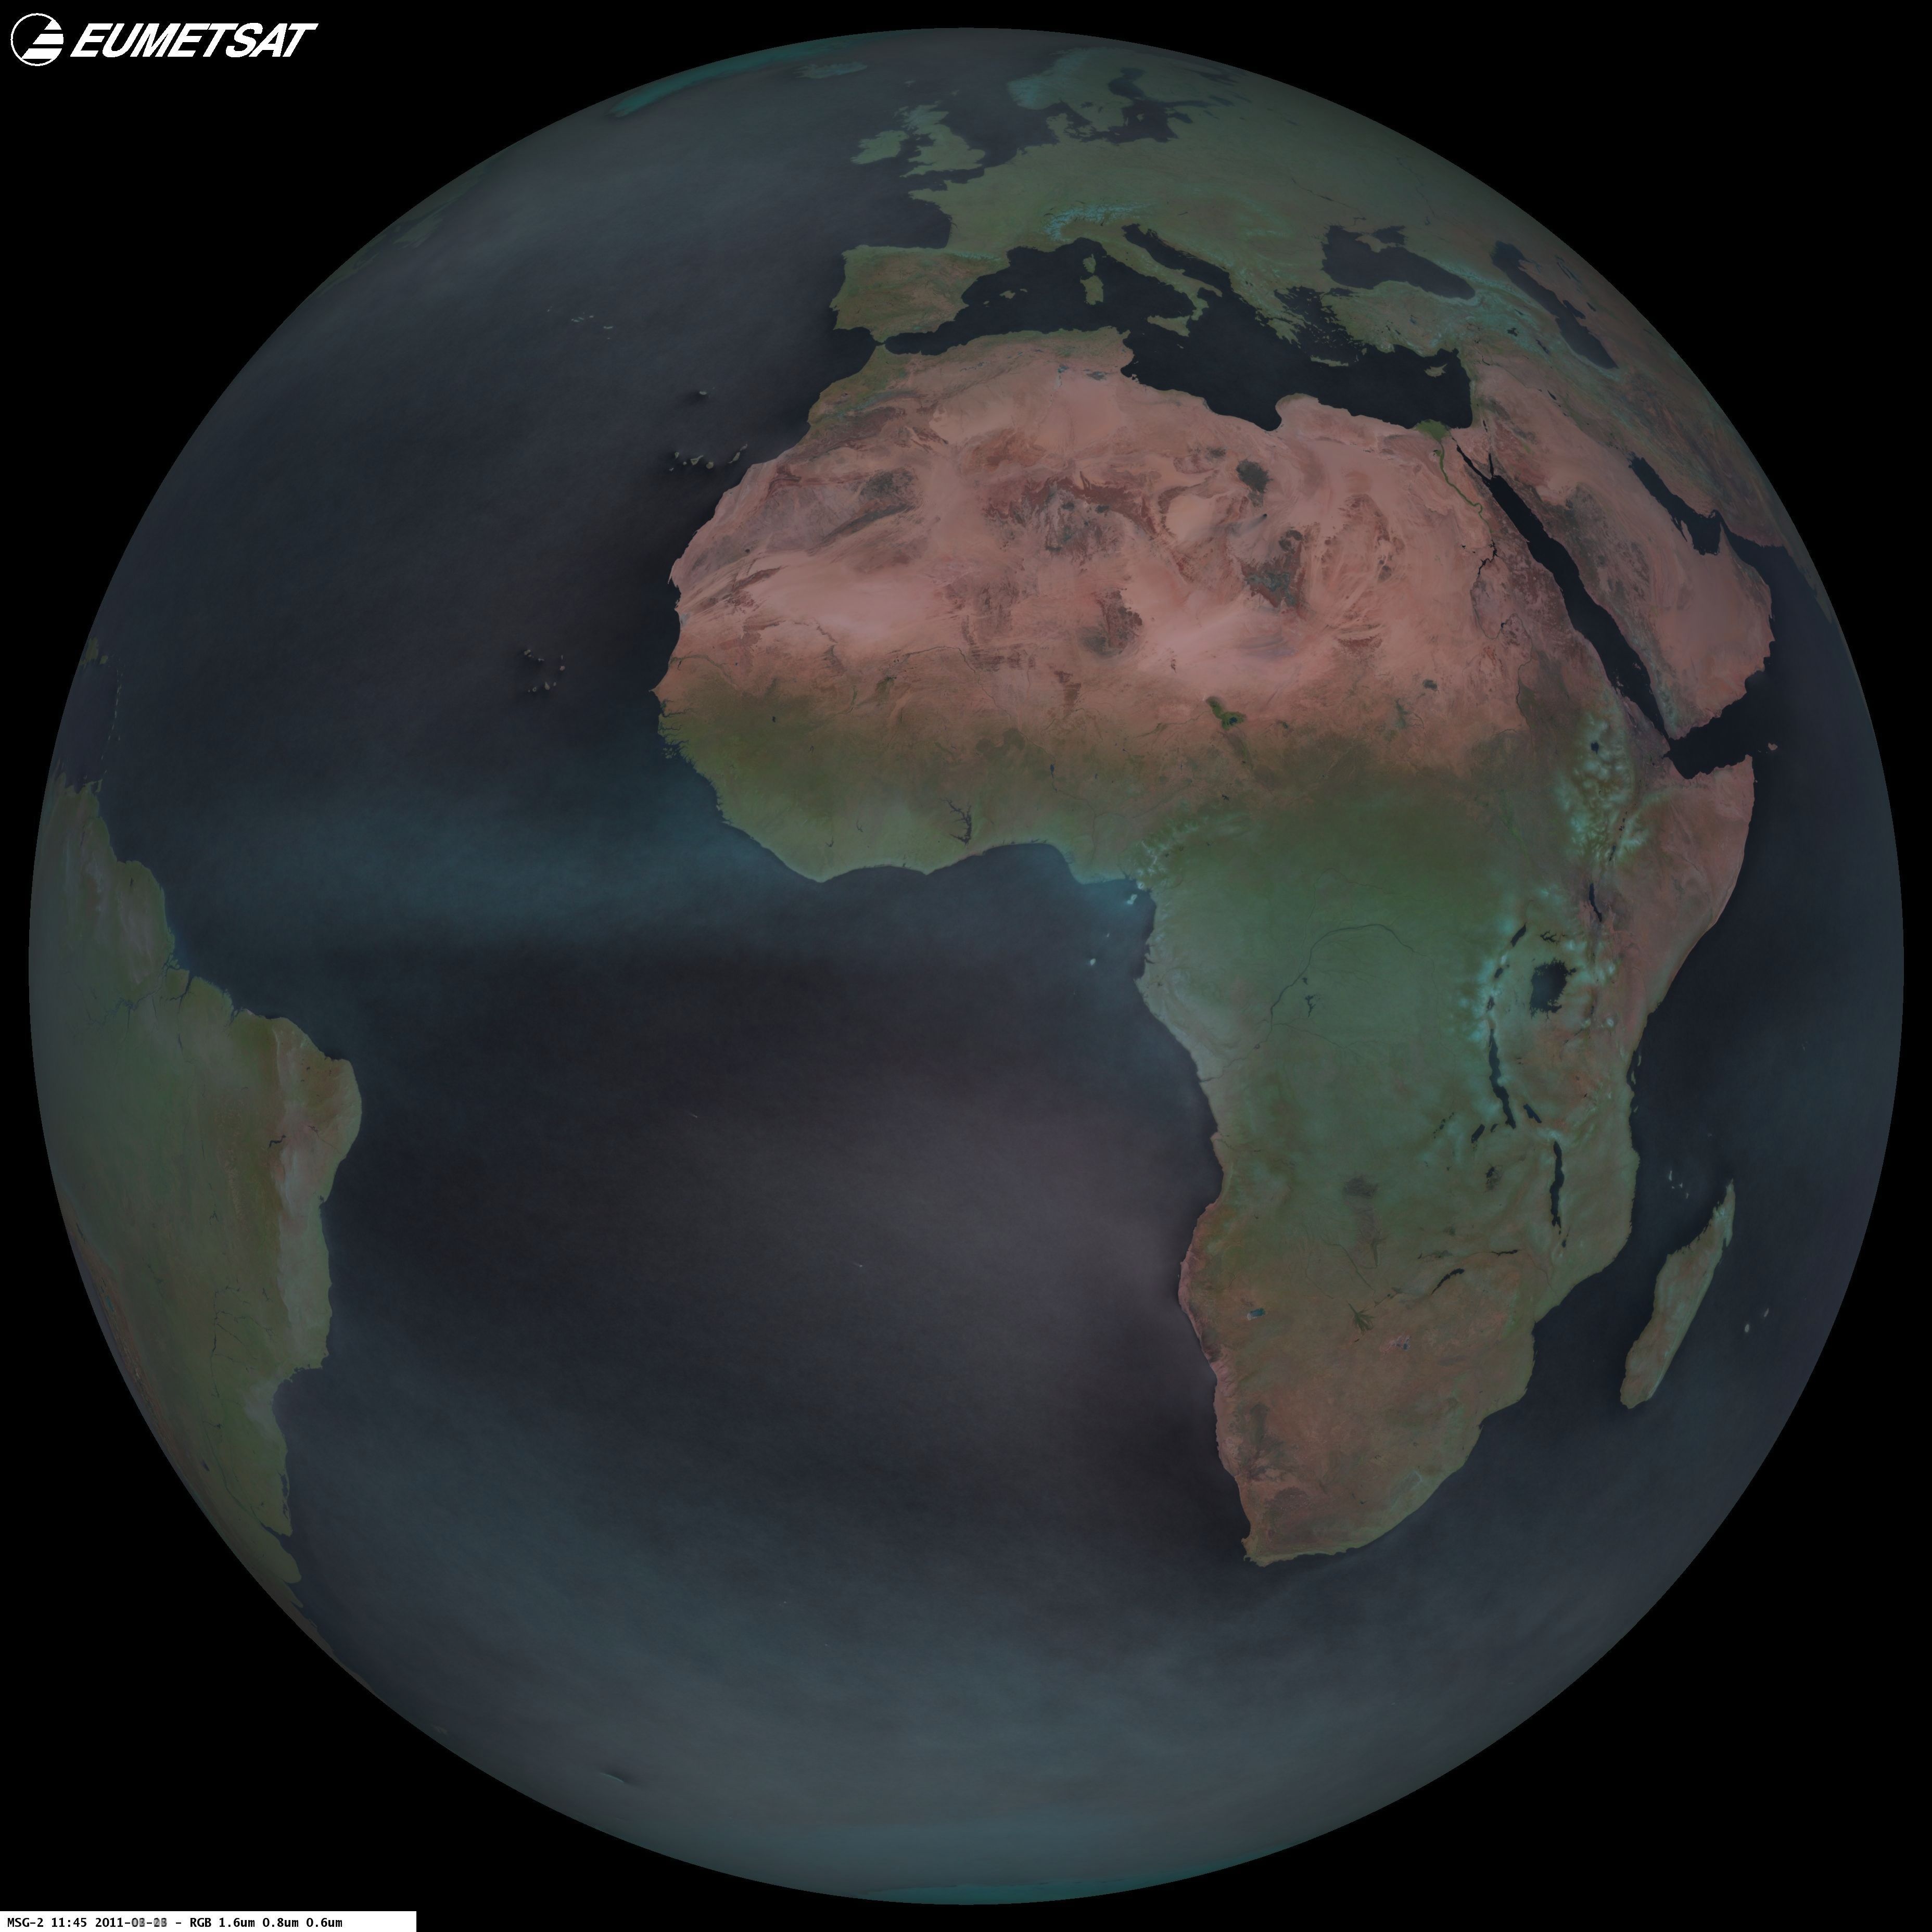
Averaging of all images
Then I took all images and made simply average of them. There are the result. First I hoped, that I'll get nice cleared continents without any clouds like from some NASA public relation materials, but the result is a little bit foggy. You can simply identify areas where the rains and convective storms are almost every day.
How it was made in GNU/Linux command line
The BASH, ImageMagick and Mencoder are used for following operations.
Batch for image resizing
X_SIZE=720
Y_SIZE=720
JPEG_QUALITY=85

for image in *.jpg
do
	echo $image
	convert -quality $JPEG_QUALITY \
			-resize ${X_SIZE}x${Y_SIZE} \
			$image JPG:frame-$image
done
Batch for image cropping
for file in *.jpg
do
	TIME=`echo $file | sed -e 's/FSD_Visible-\(.*\)-1145.jpg/\1/' \
          -e 's/\([0-9]\{4\}\)\([0-9]\{2\}\)\([0-9]\{2\}\)/\1-\2-\3/'`
	echo $TIME
	# geometry width x height + x + y
	convert -quality 85 -crop 2000x1080+198+735 +repage \
		-pointsize 40 -fill yellow -draw "text 40,1040 \"$TIME\"" \
		 $file jpg:crop-$file
done
Because my archive files are called this way: FSD_Visible-20110706-1145.jpg and I wanted to put a time stamp to picture, the sed commands prepares the right date format. The convert utility is able to add text into cropped image.
Joining several JPEGs into animation
X_SIZE=720
Y_SIZE=720
FPS=12

mencoder mf://frame-*.jpg -mf w=${X_SIZE}:h=${Y_SIZE}:fps=${FPS} \
	-ovc lavc -lavcopts vcodec=mpeg4:vbitrate=6400 -o output.avi
You can change the resolution, frame per sec. speed, and also vbitrate is important, choose the best compromise between a size and picture quality.
Averaging several images
convert img1.jpg img2.jpg img3.jpg -average results.jpg
It was not very clever to put all images on command line, due to heavy CPU and memory load, but doing it for 20 images was okay.