A look into SSTV modes
I wrote simple signal zero cross analyzer program for WAV files — frescop. You can download Frescop source (sorry, this is very early version only). Frescop detect zero crossing of PCM data amplitude, so it is useful for studying of transmission modes that use FSK (frequency shift keying) for modulating of information. Output of program is simple text file with three columns. The first is number of zero-cross , the second is a time from start of file, the third column is frequency in hertz.
292 0.096939 1888.366699
293 0.097211 1899.806519
294 0.097460 1900.366089
295 0.097732 1899.646606
296 0.097982 1900.126221
Use the output for drawing graphs shows the modulation. I use gnuplot for creation of graph below, but file can be imported as CSV format into another spreadsheet program and graphs can be created by it .
The WAV file should be recorded from band traffic, but for better quality and for the studying of slow-scan television details i produced input WAVs by MMSSTV (the best SSTV program i know).
The MMSSTV saves sound files with .mmv extension. The file contains
simple PCM raw data coded as 16bit signed numbers. To converting them into WAV
you can use the sox utility with this
option:
sox -t raw -s -w -r 11025 Recv.mmv Recv.wav
Don't forget to set proper sampling frequency if you use other than 11025 Hz.
Spectroscope view of SSTV
VIS code of Martin M1 (8bit) and MP115 (16bit)
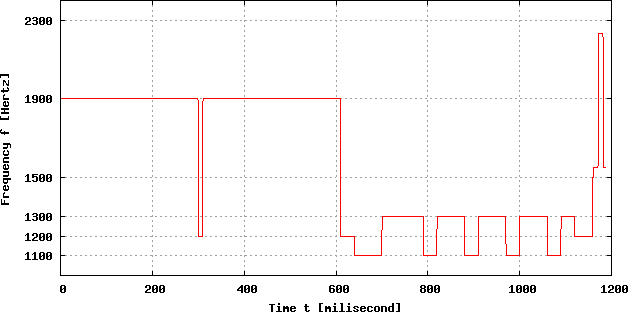
Fig.: The VIS code of MP115 mode.
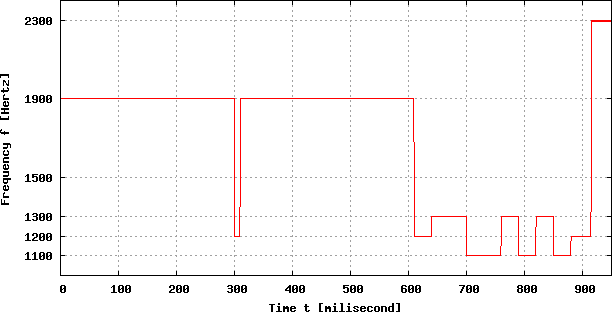
Fig.: The VIS code of Martin M1 mode.
Narrow band mode MP110-N
This atypical SSTV mode use narrow band for transmission. The video signal use band from 2044 Hz (black) to 2300 Hz (white). Synchropulse has frequency 1900 Hz and there is totally different vertical interval of signaling (VIS). The MP110-N mode use YCrCb color format 4:2:0. Between two syncs are two scan-lines transformed into four signals: Y-even (luminance), R–Y, B–Y (chrominance, the average value for two neighbouring lines) and Y-odd.
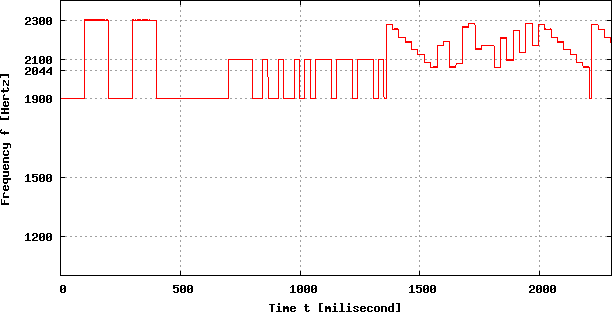
Timing sequence of MP110-N:
- Sync pulse 9.0 ms (1900 Hz)
- Sync porch 3.0 ms (2044 Hz)
- Even Y scan 223 ms
- R-Y scan 223 ms
- B-Y scan 223 ms
- Odd Y scan 223 ms
A scan-line of SSTV frames
Displayed lines belong to this color bars test chart:

Fig.: Color bars test.
Martin M1; G—B—R color format 1:1:1
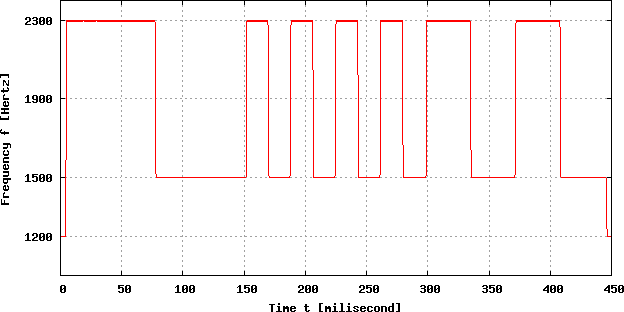
Fig.: One scan-line of Martin M1 mode.
Timing sequence of Martin M1:
- Sync pulse 4.862 ms (1200 Hz)
- Sync porch 0.572 ms (1500 Hz)
- Green scan 146.432 ms
- Separator pulse 0.572 ms (1500 Hz)
- Blue scan 146.432 ms
- Separator pulse 0.572 ms (1500 Hz)
- Red scan 146.432 ms
- Separator pulse 0.572 ms (1500 Hz)
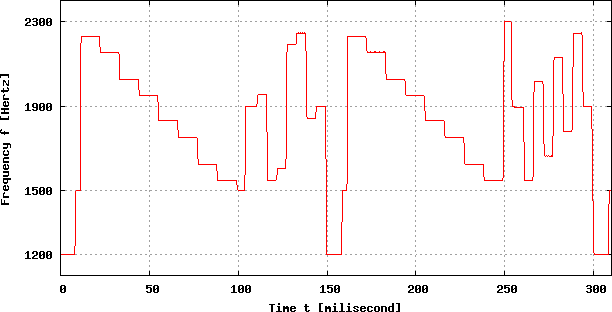
Robot 72 Color, Y—R–Y—B–Y format 4:2:2
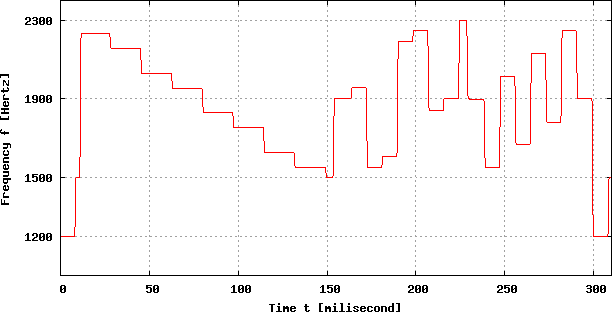
Fig.: Robot 72 Color
Timing sequence of Robot 72 Color:
- Sync pulse 9.0 ms (1200 Hz)
- Sync porch 3.0 ms (1500 Hz)
- Y scan 138 ms
- Separator pulse 4.5 ms (1500 Hz)
- Porch 1.5 ms (1900 Hz)
- R-Y scan 69 ms
- Separator pulse 4.5 ms (2300 Hz)
- Porch 1.5 ms (1500 Hz)
- B-Y scan 69 ms
Robot 36 Color, Y—R–Y—B–Y format 4:2:0
Timing sequence of Robot 36 Color:
- Sync pulse 9.0 ms (1200 Hz)
- Sync porch 3.0 ms (1500 Hz)
- Y scan 88.0 ms
- Even separator pulse 4.5 ms (1500 Hz)
- Porch 1.5 ms (1900 Hz)
- R-Y scan 44 ms
- Sync pulse 9.0 ms (1200 Hz)
- Sync porch 3.0 ms (1500 Hz)
- Y scan 88.0 ms
- Odd separator pulse 4.5 ms (2300 Hz)
- Porch 1.5 ms (1900 Hz)
- B-Y scan 44 ms